Why Sensor Data Is Useless Without the Right Industrial Monitoring Dashboard Application and Analyti
Author
Why Sensor Data Is Useless Without the Right Application Dashboard
Modern industries increasingly depend on sensors.
Temperature sensors monitor machine heat, current transformers measure electrical current, vibration sensors identify mechanical changes, pressure sensors measure process conditions, while power meters continuously record voltage, current, power, energy, frequency, and power factor.
Installing hundreds of sensors, however, does not automatically create a smart factory.
Sensors primarily generate data. If that data cannot be collected, contextualized, visualized, analyzed, and delivered to the right people, its operational value remains limited.
This is where an industrial sensor monitoring dashboard becomes essential.
PTC explains that IoT visualization can transform data from sensors, applications, and systems into contextualized information. Dashboards can provide customized views of connected devices, system status, alerts, and real-time information, allowing users to detect anomalies and take appropriate action. PTC
Sensor Data Is Not the Same as Information
Consider a temperature sensor producing the following readings:
65°C – 66°C – 68°C – 70°C – 73°C – 77°C – 82°C.
Without context, these are simply numbers.
An operator needs to know the normal temperature, warning threshold, critical threshold, rate of change, and whether temperature increases correlate with other parameters.
A dashboard transforms those readings into something meaningful:
Normal → Warning → High → Critical.
It can also present a trend graph showing that temperature is continuously increasing.
This represents the difference between raw data and actionable information.
ABB applies a similar concept through Digital Powertrain Insights, combining advanced analytics, anomaly detection, condition trend analysis, real-time dashboards, and alerts to support proactive maintenance decisions. ABB Group
1. Real-Time Visualization
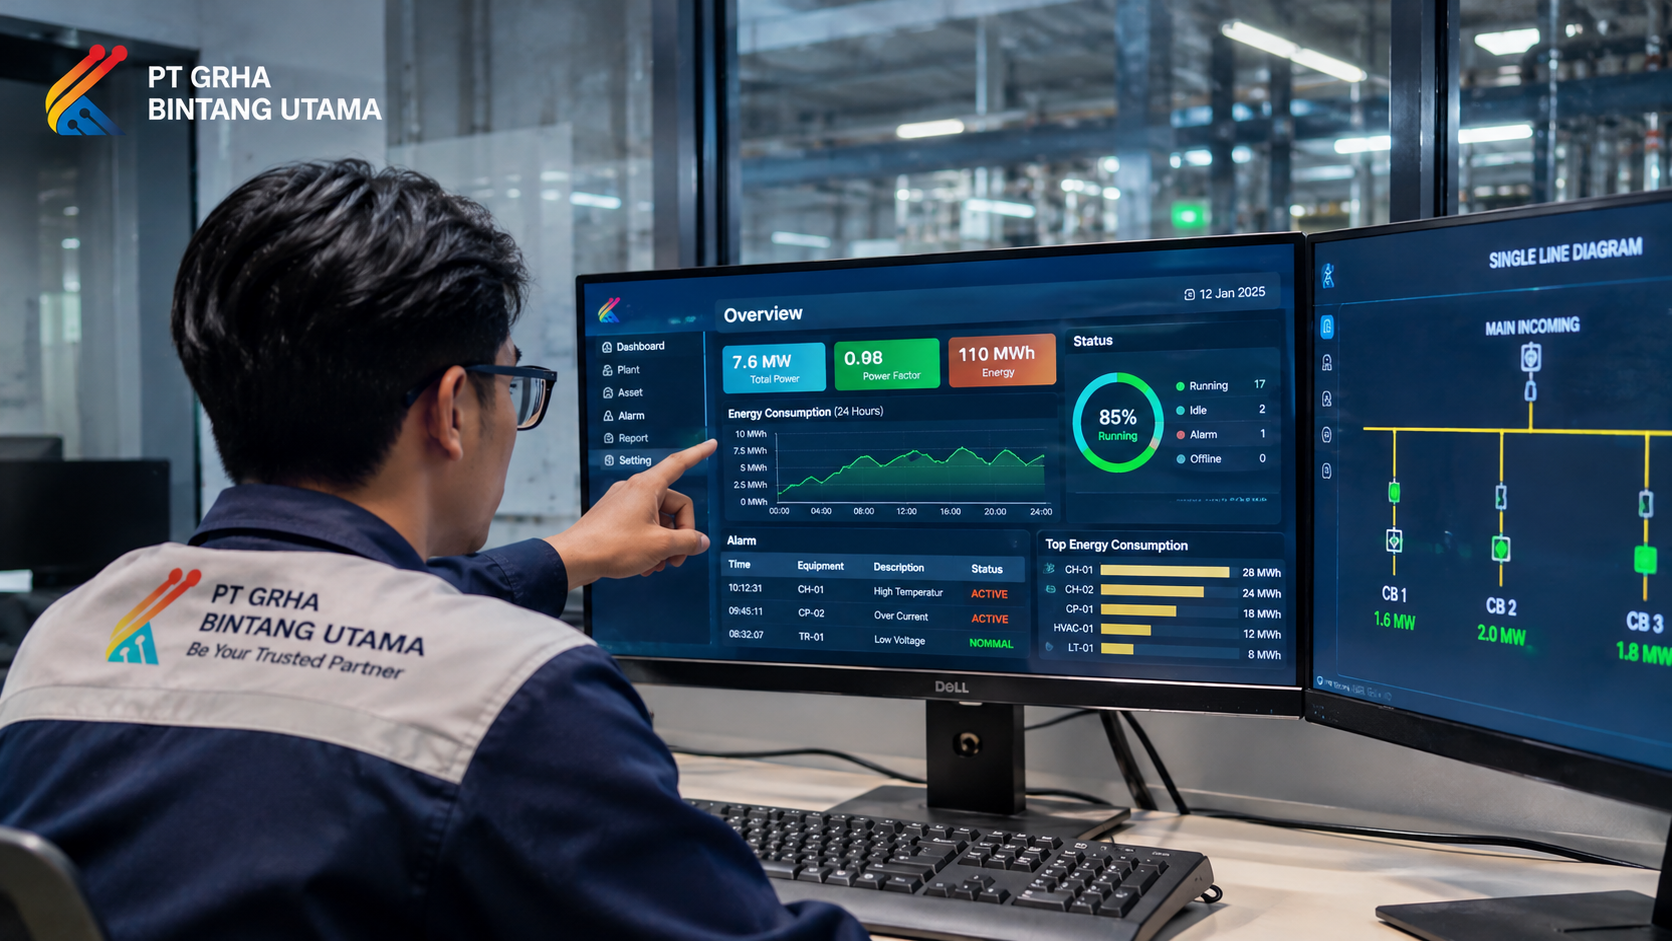
One of the primary purposes of an industrial sensor monitoring dashboard is to provide real-time operational visibility.
Instead of reading individual instruments, operators can monitor parameters such as:
- Temperature
- Current
- Voltage
- Power
- Energy
- Vibration
- Pressure
- Equipment status
- Alarm status
- Connectivity status
Information can be displayed using gauges, charts, diagrams, status indicators, and trends.
Rockwell Automation's FactoryTalk Optix similarly combines HMI and data visualization capabilities with IIoT, edge computing, data management, reporting, and dashboarding. Rockwell Automation
2. Turning Measurements into Alarms
Displaying values is only the beginning.
An effective dashboard should tell users which information requires attention.
A bearing-temperature configuration, for example, could use:
Normal: below 70°C
Warning: 70–80°C
High: 80–90°C
Critical: above 90°C
When a predefined threshold is exceeded, the dashboard can change the equipment status and trigger an alarm.
This allows operators to focus on exceptions rather than continuously watching hundreds of measurements.
3. Historical Trends Reveal Patterns
Current values are useful, but historical information can provide additional context.
Imagine a motor with vibration measurements increasing over several months:
2.1 → 2.3 → 2.8 → 3.4 → 4.2 mm/s.
The latest value alone provides only part of the story.
A historical trend reveals that the condition has been gradually changing.
PTC notes that dashboards can help maintenance technicians analyze historical data, monitor changes in current data, and interact with connected equipment. support.ptc.com
4. Supporting Predictive Maintenance
Traditional maintenance is commonly reactive or schedule-based.
With sensors, historical information, alarms, and analytics, organizations can move toward condition-based and predictive maintenance.
For example:
Current increases + temperature increases + vibration increases.
Looking at these variables together provides much greater diagnostic value than evaluating each sensor independently.
ABB describes its predictive-maintenance platform as combining analytics, anomaly detection, and condition trend analysis to provide actionable asset intelligence and help identify emerging problems before failure. ABB Group
5. The Right Information for the Right User
More charts do not necessarily create a better dashboard.
An operator may require:
Machine Status – Output – Alarm – Downtime.
A maintenance engineer may require:
Temperature – Vibration – Current – Alarm History – Asset Health.
An energy manager may require:
kWh – kW – Power Factor – Peak Demand – Cost – Energy Trend.
Dashboards should therefore be designed around user roles.
Siemens describes monitoring dashboards that can be configured according to individual stakeholders so relevant information is presented to the appropriate team. Siemens
6. Context Makes Data Valuable
A reading of 80°C alone provides limited information.
Compare it with:
Motor 01 – Drive-End Bearing – 80°C – HIGH – increased 12°C in 24 hours.
The second presentation provides context and makes the information far more actionable.
PTC highlights filtering and contextualization as important capabilities for turning large volumes of IoT data into information that users can consume and act upon. PTC
7. Good Visualization Requires Good Data
A visually impressive dashboard cannot compensate for inaccurate underlying data.
AVEVA has discussed an industrial case in which frontend visualization displayed parameters that did not match backend calculations because of interface and communication issues. AVEVA
Industrial dashboard projects should therefore consider sensor quality, calibration, communication reliability, tag mapping, timestamps, databases, thresholds, data validation, and user permissions.
The principle remains simple: garbage in, garbage out.
8. From Dashboard to Smart Factory
An industrial dashboard should not be viewed merely as a collection of graphs.
Within an Industry 4.0 architecture, it can become an interface connecting people with digital production systems.
A simplified architecture may look like:
Sensor → PLC/RTU → Gateway → Database/Cloud → Dashboard → Alarm/Analytics → Action
Rockwell Automation provides an example through FactoryTalk Optix, which can connect industrial equipment using protocols including OPC UA, EtherNet/IP, Profinet, Modbus, HTTPS, and MQTT while supporting real-time monitoring, data logging, historical alarm trends, and reporting. Rockwell Automation
This type of architecture transforms isolated sensor measurements into a connected industrial monitoring ecosystem.
What Makes a Good Industrial Dashboard?
An effective industrial dashboard should support real-time monitoring, historical trends, alarm management, role-based visualization, responsive interfaces, data integration, analytics, and reporting.
The interface should also remain easy to understand.
PTC recommends designing IIoT applications around actual user requirements—who will use the application, what they need to accomplish, what problems they face, and which information is most important. PTC also recommends prioritizing important information rather than filling limited screen space with unnecessary widgets. PTC
Conclusion
Sensors are essential to industrial digitalization, but sensors alone are not enough.
Thousands of temperature, current, voltage, vibration, pressure, energy, and equipment-status readings provide limited business value if employees cannot easily interpret them.
An industrial sensor monitoring dashboard bridges the gap between data and decisions.
A properly designed dashboard transforms raw measurements into real-time visualization, alarms, historical trends, KPIs, analytics, and actionable information.
Organizations therefore move beyond simply collecting data toward actually using data to improve equipment reliability, maintenance, energy efficiency, safety, and productivity.
For companies pursuing Industrial IoT and smart-factory initiatives, sensor investments should therefore be accompanied by an application dashboard designed around real operational requirements.
PT Grha Bintang Utama can support industrial sensing, electrical monitoring, data integration, and monitoring-dashboard solutions designed to turn operational data into information that is easier to understand and act upon.
Source :
https://grhabintangutama.co.id/5 Critical Components of a Weighbridge That Require Regular Maintenance
Read More
Transformer Monitoring: Prevent Hidden Costs from Transformer Failure and Unplanned Downtime
Read More
IoT Electrical Monitoring: How Factories Can Cut Energy Bills by Up to 15% with Real-Time Data

Read More

Jakarta Selatan, [email protected] 0812-1146-0008