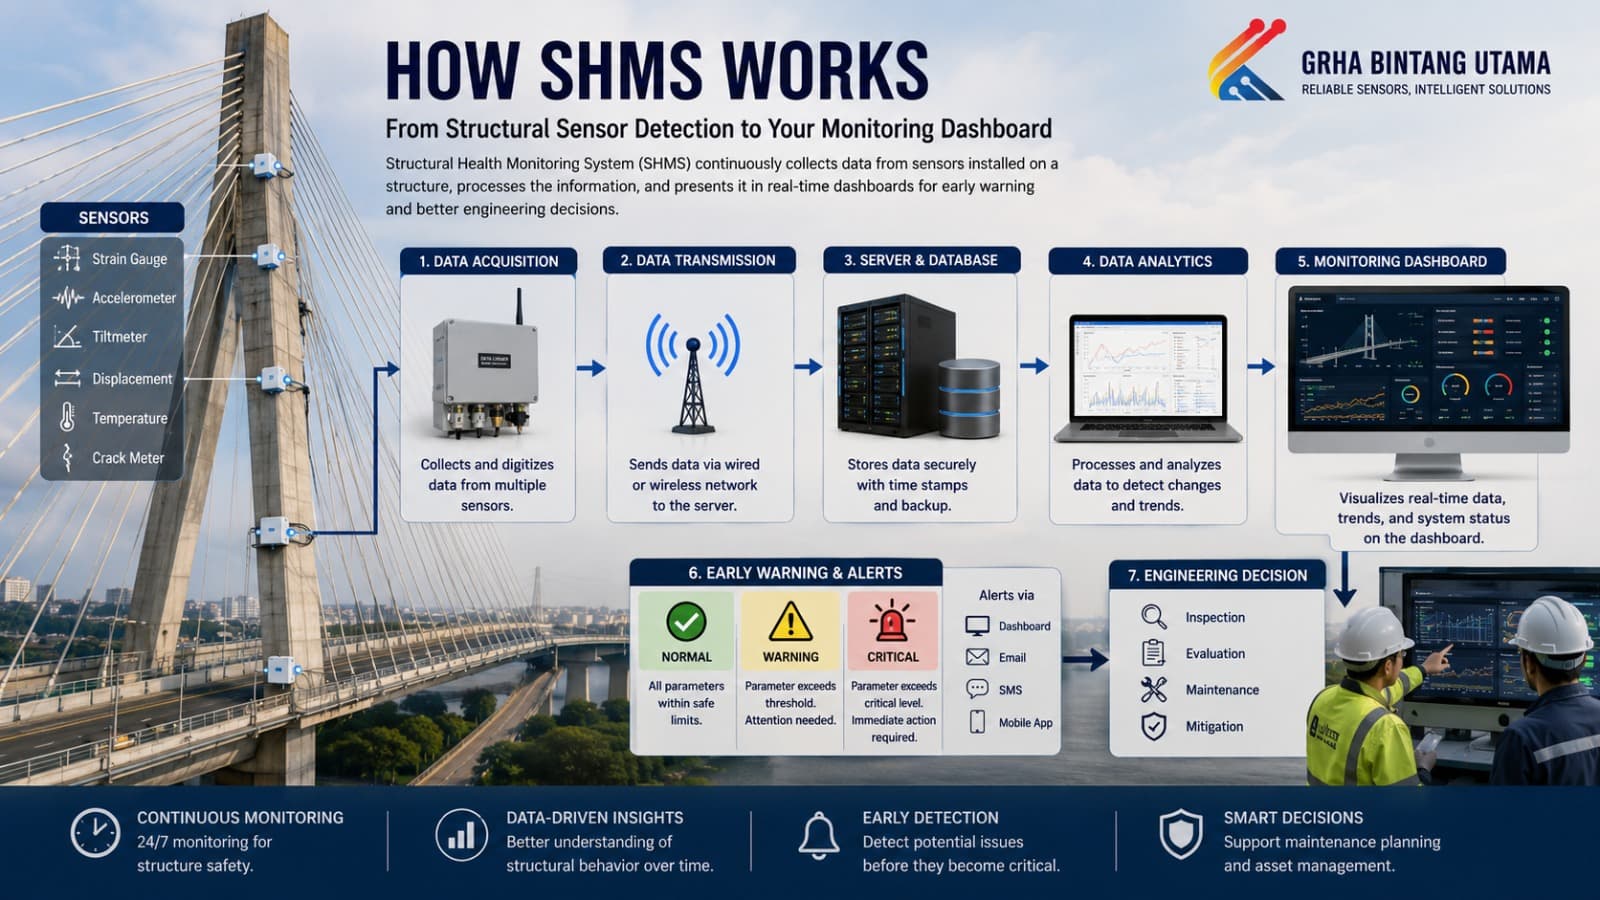
Infographic: How SHMS Works from Structural Sensor Detection to a Real-Time Monitoring Dashboard
Author
How SHMS Works: From Sensor Detection to Your Monitoring Dashboard
The rapid development of modern infrastructure has transformed the way engineers and asset owners monitor the condition of structures. Periodic visual inspections remain important, but they may not provide continuous information about how a structure behaves between inspection intervals.
Bridges, high-rise buildings, dams, tunnels, towers, industrial facilities, and transportation infrastructure are continuously exposed to different types of loads and environmental influences.
Traffic loads, wind, temperature changes, machinery vibration, human activities, ground movement, material aging, and earthquakes can all affect structural response.
This is where a Structural Health Monitoring System (SHMS) becomes highly valuable.
SHMS is a monitoring system that combines sensors, data acquisition devices, communication networks, databases, analytical software, and visualization platforms to collect and evaluate information about structural behavior.
Sensors installed at strategic locations can convert physical phenomena such as strain, vibration, displacement, inclination, crack movement, and temperature into measurable data.
In simple terms, how SHMS works can be illustrated through the following information flow:
STRUCTURE → SENSOR → DATA ACQUISITION → DATA TRANSMISSION → SERVER/DATABASE → ANALYTICS → DASHBOARD → ALERT → ENGINEER
Although this flow appears straightforward, several interconnected engineering and digital processes take place before structural movement can finally appear as a graph, indicator, status, or warning on a monitoring dashboard.
Let us explore the complete process.
1. The Structure Experiences Loads and Environmental Changes
Every SHMS process begins with the physical structure itself.
A bridge, for example, continuously responds to vehicles traveling across it. When a heavy vehicle crosses the bridge span, certain structural components may experience measurable strain and vibration.
A high-rise building may experience dynamic responses caused by wind, occupants, nearby construction activities, mechanical equipment, or earthquakes.
Industrial structures can also experience operational loads associated with machinery, temperature variations, pressure, and production activities.
Many of these structural responses are extremely small and cannot always be observed directly by humans.
For this reason, SHMS uses sensors installed at strategic locations according to the monitoring objectives and structural characteristics.
The monitored parameters may include:
- strain;
- acceleration and vibration;
- displacement;
- inclination;
- crack movement;
- temperature;
- humidity;
- force or load;
- and other environmental parameters.
The appropriate parameters depend on the type of structure, monitoring objectives, potential failure mechanisms, and engineering requirements.
2. Sensors Detect Structural Response
Sensors can be considered the primary sensing elements of an SHMS.
Without sensors, the system would have no field data describing how the structure responds to loads and environmental conditions.
Sensors convert physical quantities into signals that can be measured, transmitted, recorded, and processed electronically.
Several sensor technologies are commonly used in Structural Health Monitoring applications.
Strain Gauge
A strain gauge measures changes in strain within a structural component.
When a material experiences tension or compression, its dimensions change slightly. A strain gauge converts this deformation into a measurable electrical signal.
Strain data can help engineers understand how specific structural elements respond to applied loads.
Accelerometer
Accelerometers measure acceleration and vibration.
These sensors are particularly important for dynamic monitoring because bridges, buildings, towers, and other structures have specific vibration characteristics.
When heavy traffic, strong winds, machinery, or earthquakes generate dynamic forces, accelerometers can record the resulting structural response.
Tiltmeter
A tiltmeter measures angular movement or changes in inclination.
Tiltmeters can be installed on buildings, retaining walls, bridges, towers, and other structures where changes in inclination are important monitoring parameters.
Displacement Sensor
Displacement sensors measure relative movement between structural components or reference points.
Depending on the application, they may be used to monitor expansion joints, structural connections, bearings, or other components where movement must remain within defined limits.
Crack Meter
Crack meters monitor changes in crack width or movement.
When installed across an identified crack, the sensor can record changes over time and provide historical data for engineering evaluation.
Temperature and Humidity Sensors
Temperature and humidity monitoring can also be important because environmental conditions may influence structural behavior and sensor readings.
Environmental data can therefore help engineers distinguish between changes caused by normal temperature variation and changes requiring further structural investigation.
3. Sensors Convert Physical Changes into Signals
Once a sensor detects a physical response, it generates a corresponding signal.
Depending on the technology used, the signal may be electrical, digital, optical, or another measurable form.
At this stage, however, raw sensor signals may not yet be suitable for direct interpretation.
For example, a strain gauge may produce extremely small electrical changes. These signals may require conditioning, amplification, filtering, and conversion before they can be reliably processed.
This is why an SHMS consists of much more than sensors alone.
Sensors represent only the first stage of the entire data chain.
4. The Data Acquisition System Collects Sensor Data
After the sensors generate signals, the information is transferred to a Data Acquisition System (DAQ).
The DAQ is one of the core components of an SHMS.
Its role is to receive information from multiple sensors, perform signal conditioning where required, convert analog signals into digital data in certain configurations, assign timestamps, and forward the information to storage or processing systems.
Imagine a bridge equipped with dozens of sensors.
Sensor A measures strain.
Sensor B measures acceleration.
Sensor C measures displacement.
Sensor D measures temperature.
All of these measurements must be collected and organized so that engineers can identify:
which sensor generated the data, where the sensor is located, when the measurement occurred, what value was recorded, and what parameter was measured.
The Data Acquisition System therefore acts as a central collection point for information generated by the sensor network.
5. Signal Conditioning and Data Digitalization
Signals collected from sensors may require initial processing before they can be analyzed.
This stage is generally known as signal conditioning.
Depending on sensor technology and system architecture, signal conditioning may involve:
- amplification;
- filtering;
- electrical isolation;
- bridge completion;
- noise reduction;
- and analog-to-digital conversion.
The objective is to ensure that the data entering the monitoring system has sufficient quality and consistency for further analysis.
Filtering, for example, can help reduce unwanted noise within a signal.
An Analog-to-Digital Converter or ADC transforms analog signals into digital values that computers can process and store.
This stage is extremely important because the quality of information displayed on the final dashboard depends significantly on the quality of data collected in the field.
In other words:
Reliable monitoring begins with reliable data acquisition.
6. Data Is Transmitted Through a Communication Network
After the data has been collected and converted, it must be transferred to a storage or processing location.
An SHMS communication architecture may use wired networks, wireless technologies, or a combination of both.
The appropriate communication technology depends on factors such as:
- structure size;
- number of sensors;
- distance between monitoring points;
- sampling requirements;
- data volume;
- network availability;
- environmental conditions;
- reliability requirements;
- electrical power availability;
- and cybersecurity considerations.
For large structures such as long-span bridges or industrial facilities, communication architecture becomes a critical part of system design.
Data from different monitoring locations may first be transmitted to a local data logger or gateway before being transferred to the central server.
Depending on project requirements, communication technologies may include Ethernet, fiber-optic networks, cellular connections, Wi-Fi, or other industrial communication systems.
The objective remains the same:
to reliably transfer sensor data from the physical structure to the digital monitoring environment.
7. Data Enters the Server and Database
The transmitted data is subsequently stored in a server or database.
The database becomes a historical repository of structural behavior.
If sensors continuously monitor a structure for several years, the system may generate an enormous amount of data.
This historical information is highly valuable because engineers can compare current structural behavior with previous conditions.
For example:
Initial period: strain follows an established baseline pattern.
Six months later: the pattern remains relatively consistent.
Two years later: a gradual change appears under similar operational conditions.
Engineers can then perform additional analysis to understand the possible causes of the change.
SHMS is therefore not simply a system for viewing current sensor values.
It can become a long-term digital record of structural behavior throughout the asset's operational life.
8. Structural Data Is Processed and Analyzed
Raw sensor data does not automatically provide meaningful information to infrastructure owners.
Data processing and analytics are therefore required.
Depending on the SHMS configuration, analytical processes may include:
- signal filtering;
- normalization;
- trend analysis;
- frequency analysis;
- statistical analysis;
- event detection;
- threshold comparison;
- correlation analysis;
- modal analysis;
- and advanced analytical algorithms.
For example, accelerometers can generate large volumes of acceleration data.
Engineers can process these signals to evaluate specific characteristics of the structure's dynamic response.
Strain measurements can also be analyzed according to time, temperature, loading conditions, and sensor location.
More advanced SHMS implementations may combine information from several sensor technologies through multi-sensor data fusion.
Instead of evaluating one parameter independently, engineers can examine relationships between strain, acceleration, displacement, temperature, and other measurements.
This can provide a more comprehensive understanding of structural behavior.
9. Data Is Compared with Baselines and Thresholds
One important SHMS capability is identifying monitoring values that fall outside predetermined conditions.
For this purpose, the system may use baselines and thresholds.
A baseline represents a reference condition for structural behavior.
A threshold represents a predetermined value or condition used to determine whether additional attention may be required.
A simplified monitoring system may classify conditions into three categories:
NORMAL → WARNING → CRITICAL
When sensor readings remain within established monitoring parameters, the dashboard may display a normal condition.
When values exceed a specified threshold, the system may generate a warning.
If measurements reach another predefined level, the monitoring platform may generate a critical alert.
However, it is important to understand that a critical SHMS alarm does not automatically mean that structural failure is imminent.
Thresholds must be established based on appropriate engineering assessments, structural design information, sensor characteristics, baseline measurements, operating conditions, and other technical considerations.
An alert indicates that a particular condition requires attention, verification, or further engineering evaluation.
10. Information Appears on the SHMS Monitoring Dashboard
This is the stage that users interact with most directly.
After sensor data has been collected, transmitted, stored, and processed, the resulting information is visualized through the SHMS monitoring dashboard.
A monitoring dashboard may display information such as:
- sensor status;
- strain graphs;
- acceleration and vibration graphs;
- temperature;
- displacement;
- inclination changes;
- historical trends;
- detected events;
- alarms;
- communication status;
- sensor locations;
- and overall monitoring status.
The purpose of the dashboard is to transform complex engineering data into information that can be interpreted more efficiently.
Engineers do not need to manually inspect millions of raw database entries simply to identify which sensor is showing an unusual trend.
Instead, relevant information can be presented through graphs, indicators, status panels, maps, and historical charts.
11. The System Generates Alerts and Early Warnings
When configured with an alarm mechanism, SHMS can generate notifications when specific monitoring parameters exceed predetermined thresholds.
Notifications may be delivered through:
- monitoring dashboards;
- email;
- SMS;
- mobile applications;
- notification centers;
- control room alarms;
- or integration with other asset management systems.
This capability allows SHMS to function as part of an early warning mechanism.
For example, if a sensor detects a change in structural response that exceeds a predetermined monitoring threshold, responsible engineers can receive an alert and perform verification.
This enables infrastructure management to evolve from purely reactive maintenance toward a more condition-based approach.
The objective is not to automatically declare a structure unsafe.
Instead, the system provides earlier information that can trigger appropriate engineering assessment.
12. Engineers Evaluate the Data and Make Decisions
The final stage of SHMS involves human expertise.
A Structural Health Monitoring System does not replace structural engineers.
Instead, it provides objective monitoring data that can support engineering evaluation and decision-making.
When a dashboard indicates an anomaly, engineers may:
- verify sensor functionality;
- compare measurements with other sensors;
- evaluate historical trends;
- examine environmental conditions;
- identify relevant operational events;
- conduct field inspections;
- perform additional structural analysis;
- determine whether maintenance or further investigation is required.
This combination of automated monitoring and professional engineering judgment is essential.
Technology collects and organizes information.
Engineers interpret that information within the context of structural behavior.
Infographic: Complete SHMS Workflow
For the PT Grha Bintang Utama website, the complete SHMS process can be visually represented as follows:
1. STRUCTURE
Bridge / Building / Dam / Tunnel / Industrial Infrastructure
↓
2. SENSOR DETECTION
Strain Gauge – Accelerometer – Tiltmeter – Displacement Sensor – Crack Meter – Temperature Sensor
↓
3. SIGNAL CONDITIONING
Amplification – Filtering – Signal Conversion
↓
4. DATA ACQUISITION SYSTEM
Collect – Synchronize – Timestamp – Digitize
↓
5. DATA TRANSMISSION
Wired / Wireless / Fiber Optic / Cellular Network
↓
6. SERVER & DATABASE
Data Storage – Historical Database – Backup
↓
7. DATA ANALYTICS
Filtering – Trend Analysis – Event Detection – Threshold Analysis
↓
8. MONITORING DASHBOARD
Graphs – Sensor Status – Structural Response – Historical Trends
↓
9. EARLY WARNING
Normal – Warning – Critical
↓
10. ENGINEERING DECISION
Inspection – Evaluation – Maintenance – Mitigation
Why Is an SHMS Dashboard So Important?
The primary advantage of an SHMS dashboard is not simply its visual appearance.
Its real value lies in transforming large volumes of complex sensor information into structured engineering information.
Consider an infrastructure asset equipped with 100 sensors.
If each sensor collects measurements continuously throughout the day, the resulting database can contain an enormous number of data points.
Without visualization tools, engineers would need to manually process large amounts of information to identify unusual behavior.
A monitoring dashboard simplifies this process.
Users can select individual sensors, define specific periods, examine historical trends, compare parameters, and review detected events.
This represents one of the fundamental transformations enabled by SHMS:
Physical Response → Digital Data → Engineering Information → Decision Support
SHMS as Part of Digital Infrastructure Transformation
Digital infrastructure is not simply about converting engineering drawings into digital formats.
A more advanced transformation occurs when physical infrastructure can continuously generate information about its own behavior.
Sensors create the connection between physical infrastructure and digital monitoring systems.
Structural responses that were previously difficult to observe continuously can now be recorded according to the parameters covered by the monitoring system.
In more advanced implementations, SHMS data may also be integrated with technologies such as:
- Building Information Modeling (BIM);
- Geographic Information Systems (GIS);
- Internet of Things (IoT);
- Artificial Intelligence (AI);
- Machine Learning;
- Digital Twin technology;
- and Asset Management Systems.
These integrations have the potential to support more data-driven infrastructure management.
For example, sensor information could be associated with a digital representation of a bridge, allowing engineers to identify exactly where a sensor is located and review its historical measurements.
This creates opportunities for infrastructure owners to move toward increasingly integrated digital asset management.
Does SHMS Replace Manual Structural Inspections?
No.
SHMS and manual inspections should generally be viewed as complementary approaches.
Manual inspections allow engineers to directly observe physical conditions that may not be covered by installed sensors.
SHMS, on the other hand, provides continuous or periodic measurements for specific monitored parameters.
For example, a visual inspection may identify corrosion, concrete deterioration, or surface damage.
A sensor network may provide information about how strain, vibration, displacement, or crack movement has changed over time.
When both approaches are combined, infrastructure owners can obtain a more comprehensive picture of asset condition.
Key Benefits of SHMS for Infrastructure Owners
A properly designed Structural Health Monitoring System can provide several important benefits.
Continuous Monitoring
Depending on the system configuration, structural parameters can be measured continuously or at scheduled intervals without waiting for the next manual inspection.
Historical Structural Data
Monitoring information can be stored over long periods, allowing engineers to compare structural behavior across months or years.
Early Indication of Changes
Threshold-based monitoring can provide indications when certain parameters move outside predefined conditions.
Data-Driven Maintenance
Historical monitoring data can support decisions about inspections, maintenance planning, and further structural assessment.
Remote Monitoring
When remote access is available, authorized engineers may review monitoring information without always being physically present at the structure.
Asset Management Support
Long-term SHMS records can contribute to infrastructure documentation and support lifecycle asset management strategies.
Challenges in Implementing Structural Health Monitoring Systems
Although SHMS offers significant advantages, effective implementation requires careful engineering planning.
Sensors cannot simply be installed randomly across a structure.
Sensor locations should be selected according to structural behavior, critical elements, monitoring objectives, and potential risk scenarios.
The sensor technology must also correspond to the parameter being measured.
Several technical factors should be considered, including:
- sensor durability;
- sensor calibration;
- power supply;
- communication infrastructure;
- data quality;
- sampling rates;
- data storage capacity;
- cybersecurity;
- environmental conditions;
- sensor maintenance;
- database management;
- alarm configuration;
- and long-term system reliability.
An effective SHMS is not necessarily the system with the largest number of sensors.
A more important principle is:
the right sensor, installed at the right location, monitoring the right parameter, supported by the right analytical method.
PT Grha Bintang Utama and Data-Driven Structural Monitoring
Infrastructure assets are designed for long-term operation.
Bridges, buildings, industrial facilities, and other critical infrastructure may remain in service for decades.
Throughout their operational life, structural characteristics may be influenced by material aging, changing loads, environmental conditions, operational activities, natural hazards, and other factors.
For this reason, sensor-based structural monitoring can provide valuable additional information for infrastructure owners and operators.
PT Grha Bintang Utama recognizes Structural Health Monitoring System technology as an important component in the evolution toward more digital and data-driven infrastructure management.
By integrating sensors, Data Acquisition Systems, communication networks, databases, analytical platforms, and monitoring dashboards, structural behavior can be monitored in a more systematic and measurable way.
The result is not simply a collection of sensor readings.
It is an integrated monitoring environment designed to transform physical structural responses into useful engineering information.
Conclusion
Understanding how SHMS works means understanding the complete journey of structural data.
The process begins when a bridge, building, dam, tunnel, tower, or industrial structure responds to operational loads or environmental conditions.
Sensors detect these physical responses and convert them into measurable signals.
The signals are then collected by a Data Acquisition System, conditioned and digitalized when necessary, and transmitted through a communication network.
The information enters a server and database, where it can be stored as part of a long-term historical record.
Data processing and analytical systems then transform raw measurements into more meaningful information.
The results are visualized through an SHMS dashboard, allowing engineers to examine sensor status, structural response, historical trends, and detected events.
When predetermined thresholds are exceeded, the system can generate alerts that prompt further verification and engineering evaluation.
The complete SHMS workflow can therefore be summarized as:
DETECT → COLLECT → TRANSMIT → STORE → ANALYZE → VISUALIZE → ALERT → DECIDE
This is the fundamental concept behind a modern Structural Health Monitoring System.
SHMS connects physical infrastructure with digital monitoring technology, allowing structural responses that may otherwise be difficult to continuously observe to become measurable data.
For owners and operators of bridges, high-rise buildings, dams, industrial facilities, tunnels, and other strategic infrastructure, SHMS can become an important component of preventive maintenance, condition-based monitoring, risk mitigation, and data-driven asset management.
Ultimately, the value of SHMS is not determined simply by how many sensors are installed.
Its true value lies in its ability to transform physical structural behavior into reliable, accessible, and relevant engineering information that supports more informed infrastructure management decisions.
References & Source URLs
1. Sensors – Sensing Techniques for Structural Health Monitoring: A State-of-the-Art Review
https://www.mdpi.com/1424-8220/25/5/1424
2. Journal of Sensor and Actuator Networks – Sensor Networks for Structural Health Monitoring
https://www.mdpi.com/2571-631X/4/3/33
3. Sensors – Damage Identification in Structural Health Monitoring: A Review
https://www.mdpi.com/1424-8220/20/3/733
4. National Institute of Standards and Technology (NIST) – Physical Infrastructure
https://www.nist.gov/infrastructure/physical-infrastructure-material-measurement-lab
5. Sensors – Advanced Sensor Technologies for Non-Destructive Testing and Structural Health Monitoring
https://www.mdpi.com/1424-8220/23/4/2204
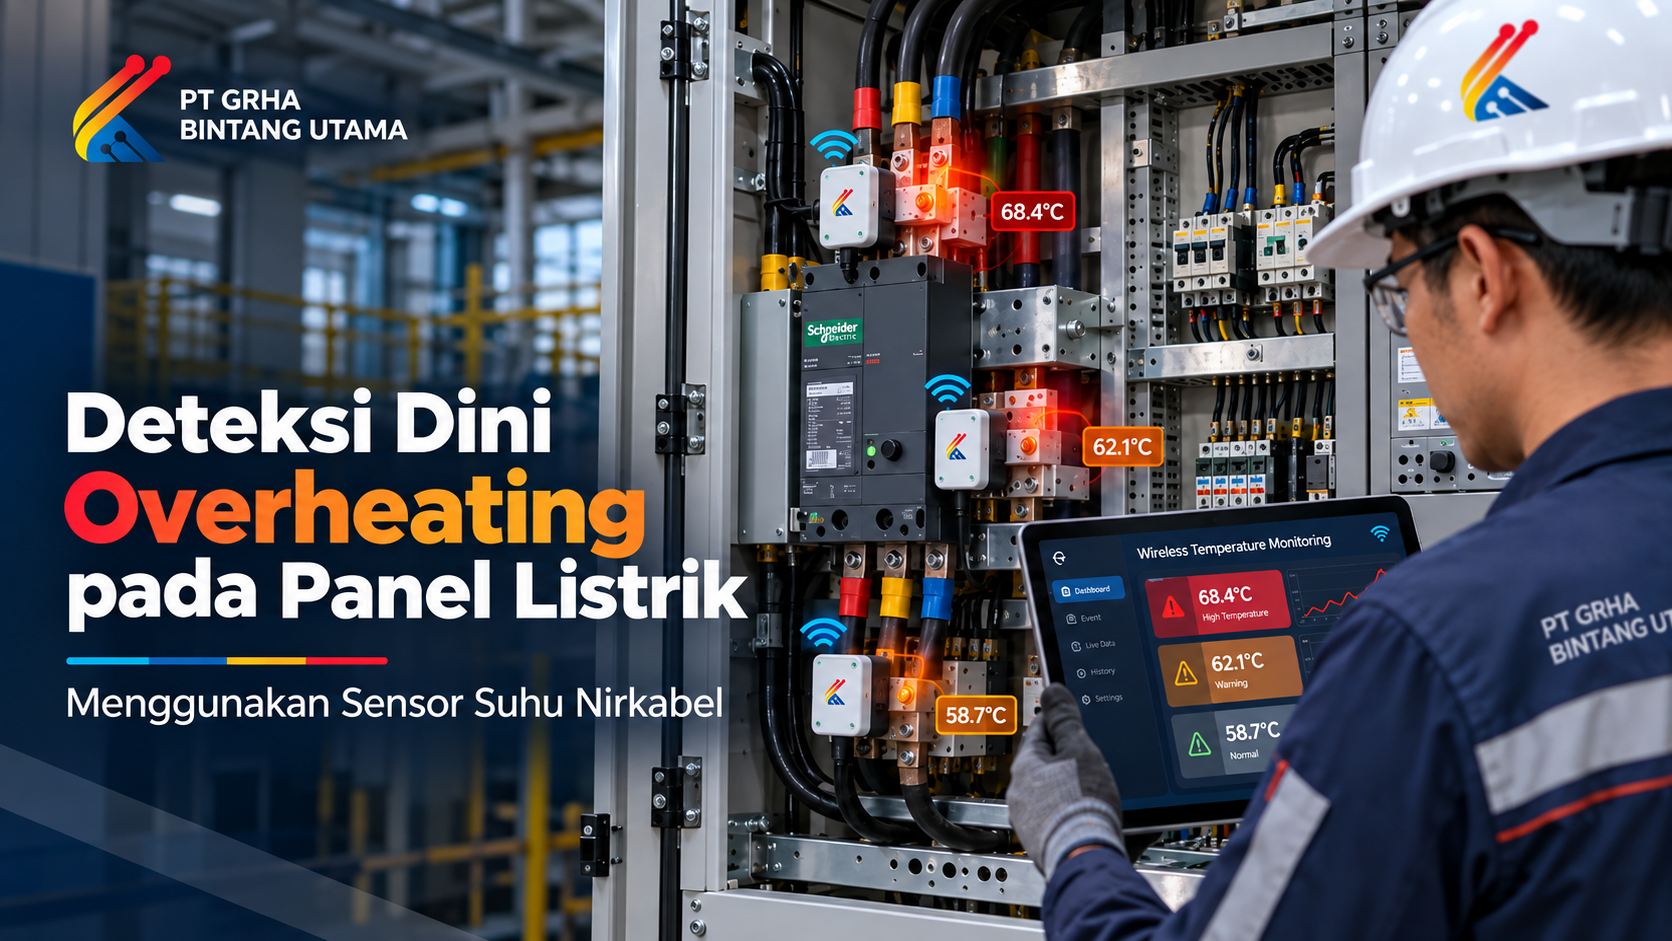
Early Detection of Electrical Panel Overheating Using Wireless Temperature Sensors for Plant Safety.
Read More
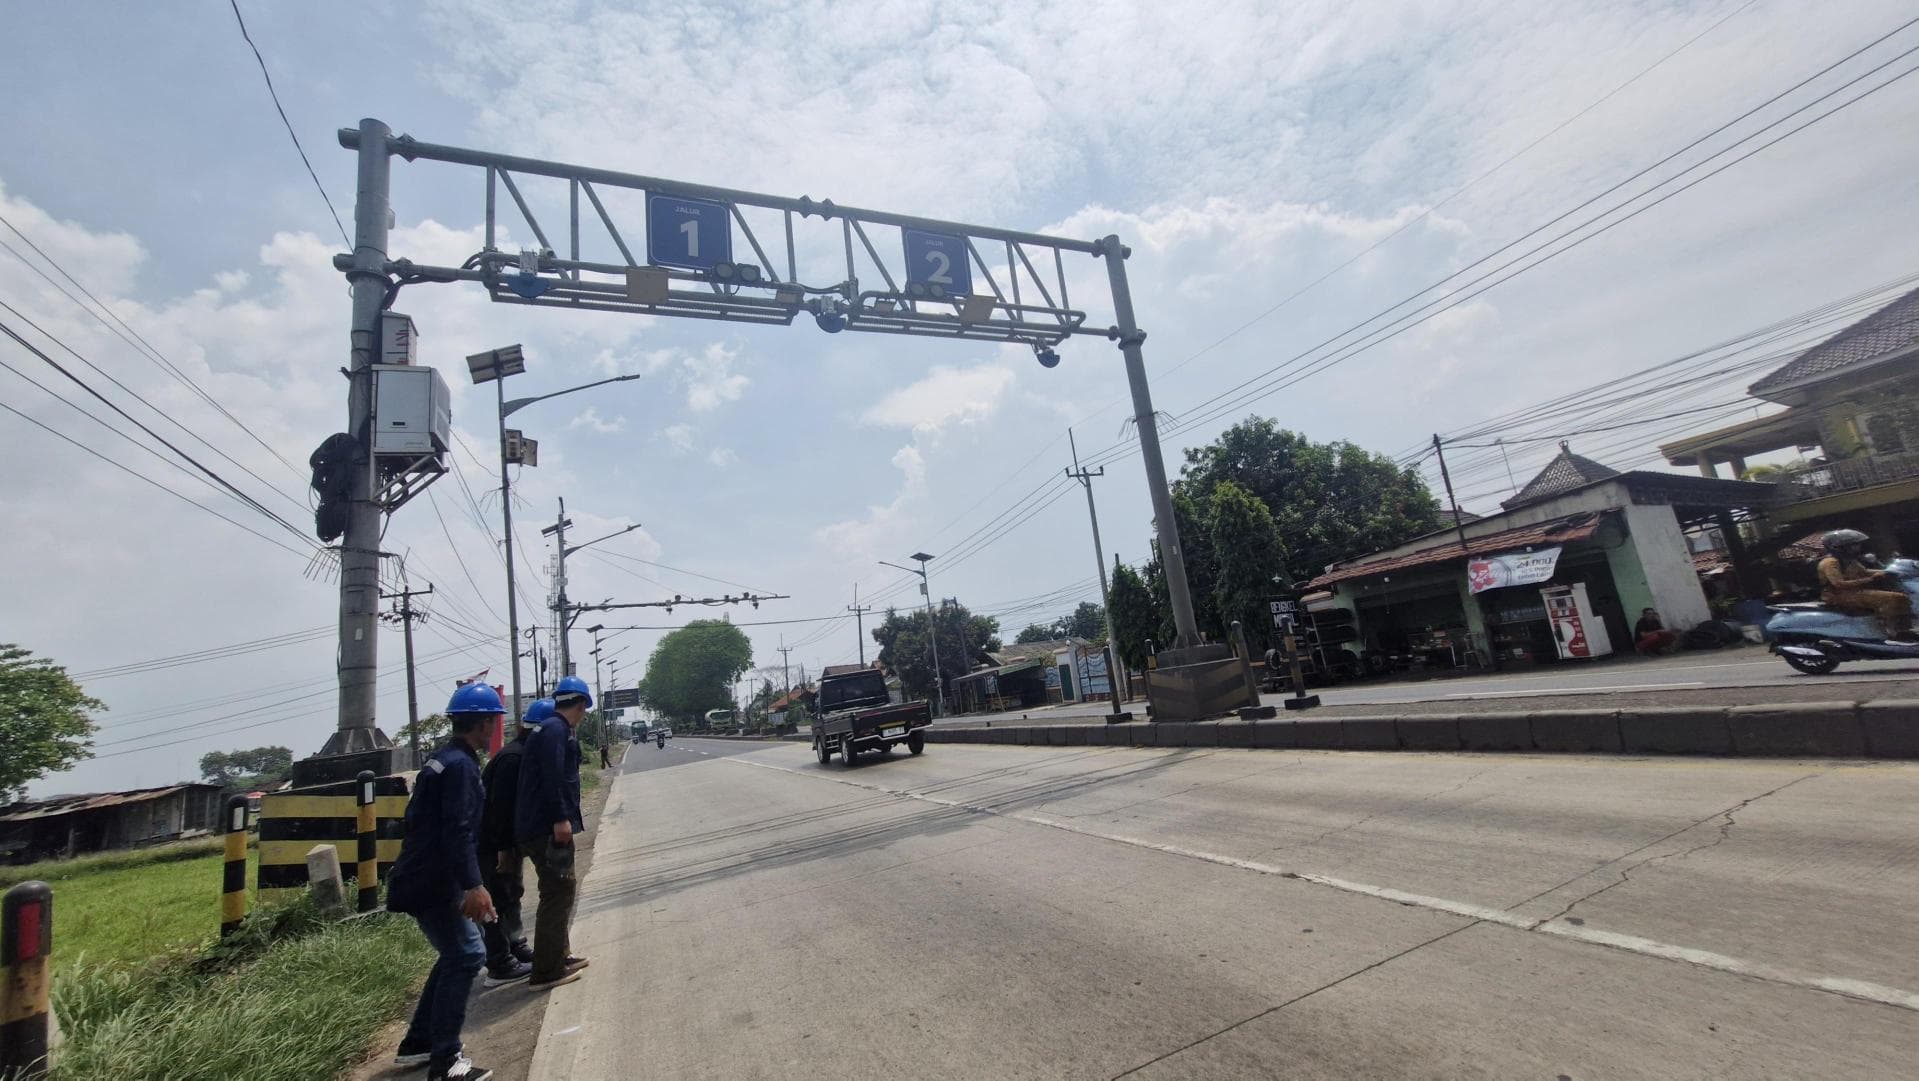
WIM System in Indonesia for Weighing Trucks Without Stopping
Read More
5 Critical Components of a Weighbridge That Require Regular Maintenance

Read More

Jakarta Selatan, [email protected] 0812-1146-0008